Anthony Betancourt
Lab Partner: Josh Fofrich
Professor Wolf
Lab #4: Modeling Air Resistance
Part 1:
Purpose:
This lab is designed to model the air resistance force on an object in free fall. The objects being dropped in the lab are coffee filters. The filters will fall from a height high enough to allow the filters time to reach a terminal velocity. This velocity can be translated into data points on a position vs. time graph. Once the position vs. time graph is plotted, the linear portion of the graph is used to calculate the slope of the line which gives us the experimental value for terminal velocity. 5 trials will be conducted in order to have sufficient data points for determining the air resistance force.
Procedure:
- Head to building 13 (Design and Technology) lobby are on the north side of the building. The balcony is where the filters will be dropped.
- Have your lab partner sit at the bottom flight of stairs set up with a video recording device.
- For the first trial, 1 coffee filter will be dropped from the balcony against a black background with a meter stick attached in order to have a reference point for distance traveled by the filter.
- Once the filter is dropped, the person sitting at the bottom of the stairs should start recording the free fall of the coffee filter. Be sure to record from the same spot for each trial.
- For trial 2 another coffee filter will be added to the drop. In theory, the mass will be doubled and each consecutive trial afterwards will have an increase in mass from each filter added.
- Repeat procedure until 5 sufficient trials are completed.
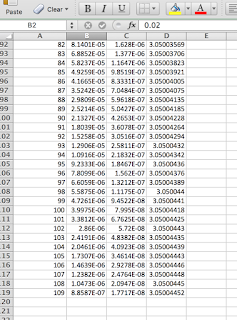
After plugging in the different masses for coffee filters into the excel model, the outcome of each terminal velocity was close to the experimental outcome. This model supports the experimental data collected and could be a useful tool in assessing any equivalent data on determining terminal velocity. Issues dealing with trials 2 and 5 (not included in power fit curve) may have stemmed from the data points collected in the video trials. The background on the hanging cloth was also not entirely opaque, making it difficult to get accurate data points during free fall. One way to combat this would be to perform the experiment against a tall wall with a larger measuring stick along the wall. Also, a video with more steady of picture to help alleviate any shakiness in recording.


No comments:
Post a Comment